

 Toll Free 1800 572 9282
  mailus@wbcsmadeeasy.in


Advantages And Disadvantages Of Matrix – Management Notes – For W.B.C.S. Examination.
ম্যাট্রিক্সের সুবিধাগুলি এবং অসুবিধাগুলি – ম্যানেজমেন্ট নোটস – WBCS পরীক্ষা।
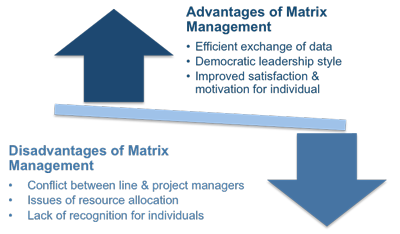
Advantages and disadvantages
Benefits of the matrix.Continue Reading Advantages And Disadvantages Of Matrix – Management Notes – For W.B.C.S. Examination.
- Easy to perform;
- Helps to understand the strategic positions of business portfolio;
- It’s a good starting point for further more thorough analysis.
Growth-share analysis has been heavily criticized for its oversimplification and lack of useful application. Following are the main limitations of the analysis:
- Business can only be classified to four quadrants. It can be confusing to classify an SBU that falls right in the middle.
- It does not define what ‘market’ is. Businesses can be classified as cash cows, while they are actually dogs, or vice versa.
- Does not include other external factors that may change the situation completely.
- Market share and industry growth are not the only factors of profitability. Besides, high market share does not necessarily mean high profits.
- It denies that synergies between different units exist. Dogs can be as important as cash cows to businesses if it helps to achieve competitive advantage for the rest of the company.
Using the tool
Although BCG analysis has lost its importance due to many limitations, it can still be a useful tool if performed by following these steps:
- Step 1. Choose the unit
- Step 2. Define the market
- Step 3. Calculate relative market share
- Step 4. Find out market growth rate
- Step 5. Draw the circles on a matrix
Step 1. Choose the unit
BCG matrix can be used to analyze SBUs, separate brands, products or a firm as a unit itself. Which unit will be chosen will have an impact on the whole analysis. Therefore, it is essential to define the unit for which you’ll do the analysis.
Step 2. Define the market
Defining the market is one of the most important things to do in this analysis. This is because incorrectly defined market may lead to poor classification. For example, if we would do the analysis for the Daimler’s Mercedes-Benz car brand in the passenger vehicle market it would end up as a dog (it holds less than 20% relative market share), but it would be a cash cow in the luxury car market. It is important to clearly define the market to better understand firm’s portfolio position.
Step 3. Calculate relative market share
Relative market share can be calculated in terms of revenues or market share. It is calculated by dividing your own brand’s market share (revenues) by the market share (or revenues) of your largest competitor in that industry. For example, if your competitor’s market share in refrigerator’s industry was 25% and your firm’s brand market share was 10% in the same year, your relative market share would be only 0.4. Relative market share is given on x-axis. It’s top left corner is set at 1, midpoint at 0.5 and top right corner at 0 (see the example below for this).
Step 4. Find out market growth rate
The industry growth rate can be found in industry reports, which are usually available online for free. It can also be calculated by looking at average revenue growth of the leading industry firms. Market growth rate is measured in percentage terms. The midpoint of the y-axis is usually set at 10% growth rate, but this can vary. Some industries grow for years but at average rate of 1 or 2% per year. Therefore, when doing the analysis you should find out what growth rate is seen as significant (midpoint) to separate cash cows from stars and question marks from dogs.
Step 5. Draw the circles on a matrix
After calculating all the measures, you should be able to plot your brands on the matrix. You should do this by drawing a circle for each brand. The size of the circle should correspond to the proportion of business revenue generated by that brand.
For Guidance of WBCS (Exe.) Etc. Preliminary , Main Exam and Interview, Study Mat, Mock Test, Guided by WBCS Gr A Officers , Online and Classroom, Call 9674493673, or mail us at – mailus@wbcsmadeeasy.in
Visit our you tube channel WBCSMadeEasy™ You tube Channel
Please subscribe here to get all future updates on this post/page/category/website