

 Toll Free 1800 572 9282
  mailus@wbcsmadeeasy.in


W.B.C.S. Examination Notes – Von Thunen Model – Economic Geography Notes.
Philip Steadman from the Bartlett School of Graduate Studies and a team at the Open University back in 1998 developed a sketch model based on the von Thunen’s theory of land rent. This was designed to teach beginning students of technology about the land use structure of cities in urban economic terms.Continue Reading W.B.C.S. Examination Notes – Von Thunen Model – Economic Geography Notes.
It is so simple and so intuitively attractive that we still use it a lot to demonstrate the idea of how simple models can be brought alive by simple software. An implementation of the von Thunen model was first implemented in the IDRISI software by Randy Dodson at the NCGIA in the early 1990s from an idea by Waldo Tobler. Following the instructions below, this program can either be run from this website or it can be downloaded for use on your own desktop.
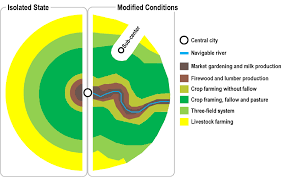
In essence what this software does is present the user with a blank homogeneous plain, in the terminology of urban economics – a landscape on which a central place or market or town is ‘planted’.
The user can then use the drawing tools in the Design mode to add more towns, transport routes, rail routes, and non-productive land which act as constraints on the distribution of land uses. If there are no constraints (other than just the placement of the central node), then the model generates a symmetical land use pattern around the central town. The land use pattern depends on how the transport and market price lines – bid rent curves in the jargon – interact with each other.
Essentially the von Thunen model assumes that land use is determined by the market price less the transport cost and from the interaction of these bid rent curves, a land use will dominate at any point a given distance from the town (or from competing towns). You can also alter the shape of the bid rent and cost curve using sliders. You can then display the land use map and look at the map as a 3-D surface of rents. You can manipulate this surface using sliders as well in oblique projection.
The various pictures show you the sequence of steps in the program using a single town – the red dot in the middle of the top screen shows the location, and then the bid rent curves which the user can adjust. The circular town configuration of land uses is shown below and finally this can be seen in 3-D. You can import map pictures of real places and run the von Thunen model with towns and roads etc. planted on such backcloths. You can access the drop down menus to do this and you can also change the weights that way and incorporate a fuzzy distance calculations.
Please subscribe here to get all future updates on this post/page/category/website