


 +919674493673
  mailus@wbcsmadeeasy.in


Environment Notes On – Population Regulation – For W.B.C.S. Examination.
পরিবেশ নোট – জনসংখ্যা প্রবিধান নিয়ন্ত্রণ – WBCS পরীক্ষা।
Balancing the growth potential of all populations are various extrinsic environmental factors that act to slow population growth as the number of individuals increases. High population density depresses the resources of the environment, attracts predators, and, in some cases, results in stress-related reproductive failure or premature death. As population size increases, typically death rates of individuals increase, birth rates decrease, or both.Continue Reading Environment Notes On – Population Regulation – For W.B.C.S. Examination.
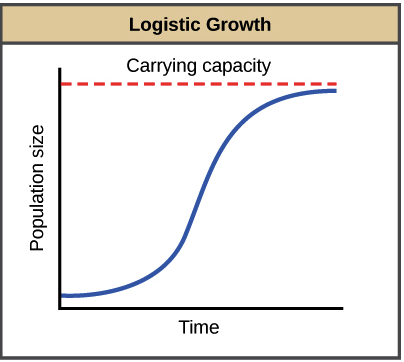
The result is a slower growth rate and a changed, usually older, population. The predominant model used by animal ecologists to describe the relationship of population growth rate to population size (or density) is the logistic equation, in which the exponential growth rate of the population decreases linearly with increasing population size:
where r0 is the exponential growth rate of a population unrestrained by density (i.e., whose size is close to 0) and K represents the number of individuals that the environment can support at an equilibrium level, also referred to as the carrying capacity of the environment.
Notice that when N < K, the growth rate is positive and the population grows. When N >K, the density-dependent term (1 – N/K) is negative and the population declines. When N = K, the growth rate is 0 and a stable, steady-state population size is achieved. This depressing impact of density on the population growth rate is known as negative feedback.
The differential form of the logistic equation may be integrated to provide a function for the trajectory of population size over time,
The curve is sigmoid (S-shaped), with the rate of growth, dN/dt reaching a maximum (the inflection point) at N = K/2. Because this is the density at which individuals are added to the population most rapidly, the inflection point also represents the size of the population from which human consumers can remove individuals at the highest rate without causing the population to decline. Thus, the inflection point is also known as the point of maximum sustainable yield.
Density dependence can take on a variety of forms. One of these is a saturation model where the exponential growth rate remains constant and positive until a population completely utilizes a nonrenewable resource such as space, and population growth stops abruptly. The approach of a population to an equilibrium level determined by density-dependent processes can be altered by environmentally induced changes in the intrinsic rate of population growth or in the carrying capacity of the environment.
Difficulties in finding mates and maintaining other social interactions at low densities, including group defense against predators, may also cause the population growth rate to decrease as density declines (the Allee effect), and, below a certain density threshold, may even result in population decline to extinction. This type of response is a positive feed-back, one that promotes population instability. For example, after commercial hunting had reduced populations of the passenger pigeon to low levels, the decline in social interactions in this communally nesting species is thought to have doomed it to extinction.
Populations have inherent oscillatory properties that can be triggered by time lags in the response to changing density and which cause populations to fluctuate in a perpetual limit cycle, with alternating population highs and lows. In these cases higher values of r can send a population into unpredictable chaotic behavior, increasing the risk of extinction. In a population with continuous reproduction, regular population cycles occur when there is a lag, often equal to the period of development, in the response of a population to its own density effects on the environment. When the time lag is of period τ, limit cycles develop when rτ exceeds π/2, and the period of the cycle is 4 to 5 times τ.
Please subscribe here to get all future updates on this post/page/category/website